Cleartelligence Acquires Bardess
Stronger Together:Bardess Group Acquired by Cleartelligence We are thrilled to announce that the Bardess Group is now part...
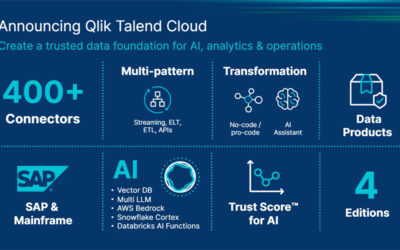
Unlock Superior Data Management with Qlik Talend Cloud
Unlock Superior Data Management with Qlik Talend Cloud An efficient and reliable data integration platform is a crucial...
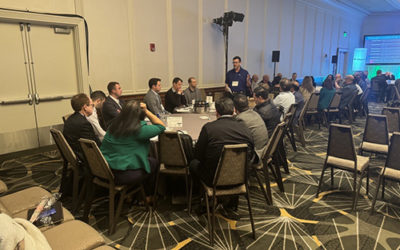
Bardess at FIMA, the World’s Leading Financial Data Management Conference
The Bardess team joined finance leaders from around the US at the World’s Leading Financial Data Management Conference in...
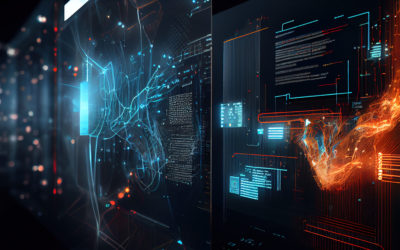
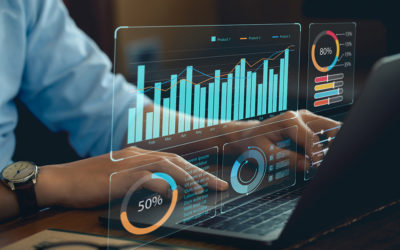
Navigating the Landscape of Data Visualization Tools: Insights into Choosing the Right Fit
In the data-driven era, the ability to transform complex datasets into visual narratives is a game-changer. This is where...
Unlocking Enterprise Value: The Power of Business Intelligence and System Integrators
Data has emerged as a strategic asset that holds the key to unlocking enterprise value. Modern businesses are turning to...
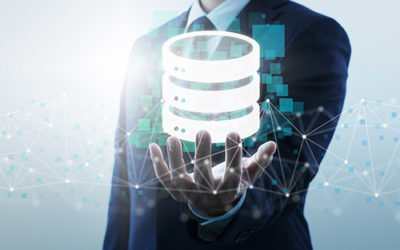
The Power of Talend: What it Can Do for Your Enterprise
Data is one of a business's most valuable assets. As enterprises worldwide strive to remain competitive, it has become...
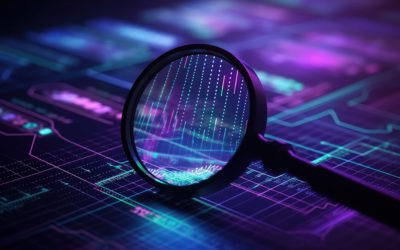
What is Streamsets Data Collector, and why is it a game changer for some clients?
The exponential growth of data in the enterprise demands a powerful and intuitive tool that can quickly understand and...
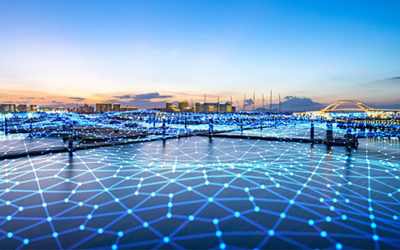
Azure Data Lake: Unlocking the Power of Your Data
In today’s digital landscape, businesses are constantly being bombarded with vast amounts of data from various sources. The...

The Essential Role of a Data Architect in Data Analytics and Data Science
Data architects play a crucial role in ensuring the successful implementation of data science and analytics projects. They...
ACG Awards
Bardess CEO Barbara Pound on Why Bardess Exemplifies Innovative Strategies, a Culture of Continuous Excellence and...

The Importance of Data Governance in the Modern Enterprise
In the modern enterprise, data is the backbone of decision-making. With an increase in data volume and complexity, ensuring...
Achieving Seamless Data Integration for Hybrid & Multi-Cloud Environments
As organizations shift towards a more dynamic and agile approach, data integration has become more of a challenge than ever...
Why Choose Bardess?
Meeting Your Goals
We assist and lead our clients with integrating data into their business flow, environment optimization, migration to the cloud, and effective reporting to successfully accomplish their business unit and IT goals.
Bardess Value
Bardess empowers clients to access, view, analyze and use their data to make smarter, more accurate, cost efficient, and faster business decisions. Our customized advanced capabilities reduce costs and time-to-market deployment.
Our Client List
For 26 years, Bardess has focused on solving Fortune 500 and other organizations’ most difficult, complex, and critical data problems with our innovative Zero2Hero® accelerated time-to-value results framework.
The Bardess LEAP
We apply our LEAP engagement methodology to achieve an elastic data solution model across our four practices – Data Strategy, Data Engineering & Architecture, Data Analytics and Data Science.
Contact Bardess
Main Office
Randolph, NJ 07869
Call Us
Email Us