By Trey Smith
Lead Consultant – Data Visualization
This year at Qonnections, I presented the idea of making the move from QlikView® to Qlik Sense®. This is something that I have thought a lot about, because personally it was something that I encountered myself as a Qlik developer. It is an intimidating change and it doesn’t seem like a lot of people talk about it openly, except for all the new features you’ll get when going to Sense. What I wanted to do is take what I did for the presentation and boil that down into a blog post, which can hopefully help others that weren’t able to attend.
To address this topic, I want to help answer three main questions:
- What is the difference between QlikView and Qlik Sense?
- How does this affect our users?
- How does our development process change?
I believe if you can feel comfortable answering these, making the change will be much easier.
What is the difference between QlikView and Qlik Sense?
This seems to be a pretty simple question, right? On the surface you’re right. However, until you have been heavily exposed to both tools, it is hard to fully grasp.
Analytic Differences
From a bird’s eye view: they are both Business Intelligence tools, they both use the Associative Engine, and are products released by Qlik, QlikView being the first. While there are many similarities, the type of analytics the tools provide are different. QlikView is a product focused on Guided Analytics. The tool provides the ability for the user to answer ad hoc questions by filtering down data sets and harnessing the value of green, grey, white. Though ultimately, the users are being led down a path and asking questions along the way. Qlik Sense, started as tool really focused on Self Service Analytics, which gives the users the ability to create their own path and generate their own insights. Over the years, with all the new features, it has evolved into a new generation product that’s is called Augmented Analytics. Not only are you able to give users the ability to create their own insights, using governed data, but now the tool generates insights for the users using AI with the Cognitive Engine. This really empowers the users and requires a shift in mindset. IT no longer needs to create a dashboard when the data doesn’t provide the answer that the user is looking for. They are now responsible for creating data models that are tried and true and creating applications that are fit for self-service, focusing on complex expressions to be used in Master Items, complex data problems and performance tuning.
Tool vs. Platform
If you haven’t used Qlik Sense before, it has what is called The Hub. The Hub is the UI/UX portion of this tool. This is the place where a user sees all their apps, similar to Access Point. The menu bar, the chart settings menu, the canvas you can drag charts onto; all of that great stuff. On the other side, Qlik Sense has their open APIs, which hooks into the engine, repository, and other back end components. It was an offhand comment from someone within Bardess, that totally changed my perception of Qlik Sense.
“The hub is really just Qlik’s interpretation of what can be done with the API’s.”
When I heard that, I started to understand the possibilities available. Qlik Sense has all the framework there for you to create whatever you want on top of their tool. If you wanted to, you could recreate the hub yourself. All the API’s are there. Now I wouldn’t advise you to do that, but what this means is they have opened the tool for everyone to extend it, leaving the possibilities endless. To me that means it is no longer a tool, but a platform.
QlikView, while it shares several of the same components and it can be extended through macros and there are a few sets API’s to allow custom configurations and integrations, it is what it is: a tool.
The Audience
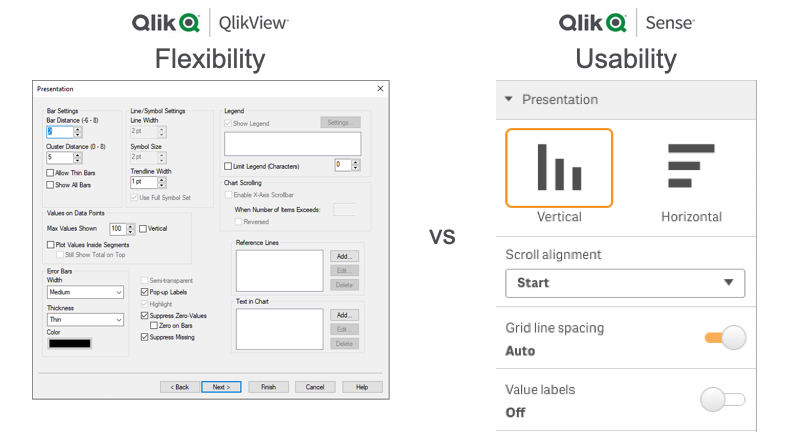
Take a look at the two bar chart presentation menus below:
The first thing you’ll notice is how many options there are in the QlikView menu. With QlikView, you can tweak, adjust, and wrangle objects in so many directions. With Qlik Sense, it’s simple. They have forced some best practices into the visualizations, and have taken a route of making it intuitive, even if that means taking away some features. So, you will find that Qlik Sense was built for the majority. There may be some use cases you can accomplish in QlikView that you can’t in a native Qlik Sense object, but that’s okay if it means a business user can make their own chart without getting overwhelmed.
How will this affect our users?
This is not a version change; it is a product change.
When companies switch BI products, there is always a period of change management that needs to take place to be successful. Unless QlikView was your first BI product, your company at some point transitioned from another tool, whether it was OLAP, query based, homegrown, enterprise, etc. You probably had a bit of resistance switching, if not more. There will always be strengths and weaknesses between tools, some bigger than others, but for the most part the users understand that there is going to be a significant change between tools. Though they might have been disgruntled that a feature they loved wasn’t there, the tradeoffs were worth the switch and they ultimately got past it. The unforeseen problem with Qlik Sense you will face is this is not their first impression to Qlik. When users are going from say IBM’s Cognos to QlikView, it is obvious things are different. With Qlik Sense, users will feel uncomfortable in what seems to be a familiar place. I frequently hear users think of Qlik Sense as the new QlikView. However, it is crucial to get the point across that you are not going from QlikView 12 to QlikView 13. This is not a version change; it is a product change.
Growing Pains
When the users see the same but slightly different: green, grey, white, that comfortability is there. However, anything that they could do QlikView that they can no longer do in Qlik Sense will feel like a step backwards. As I mentioned earlier in this post, there needs to be a mental shift on analytics and an understanding that these products are different. While change management is much, much easier; it is still a necessity.
It is hard to go to a new product that’s missing features you previously had, especially in what seems to be a similar tool. In the past it was much harder to explain, looking at your horizontal scrollbars, but it has gotten leaps and bounds better. Also, at this year’s Qonnections, Qlik has been committed to closing the gap and made it a priority, so I expect to see them catching up even faster than before.
Different Mindset
I can’t stress this enough: Your users will need to start to think of analytics differently. Users are empowered more now than they have ever been. Some will be excited, some will not. With the Data Manager, ETL is now available through a user interface. With the Cognitive Engine, visualizations can be created for you through AI. And with Insight Bot, you now have conversational analytics. Analytics are getting easier and easier to leverage. But at the end of the day, that is still change and some people will resist and won’t be ready to move outside their comfort zone. While you can create guided analytics in Qlik Sense, which there are definitely use cases for, I think we need to take some responsibility in helping those users and take ownership of change management. If we continue to let our users stay stagnant in their way of reporting and analytics, someone else, potentially somewhere else, will be evolving with their use of analytics. We all know we can make better decisions using data. It will only be a matter of time until those evolving in analytics, will evolve in business as well. Which side would you rather be on?
How does our development process change?
Qlik Experience
Originally, I was a bit intimidated going from a QlikView developer to working in Qlik Sense. From personal experience, it is easier than you think.
There are many things that are the same across both tools:
-
- Qlik Scripting Language (ETL)
- Data Modeling
- Associative Engine
- Expressions
- Set Analysis
- Functions
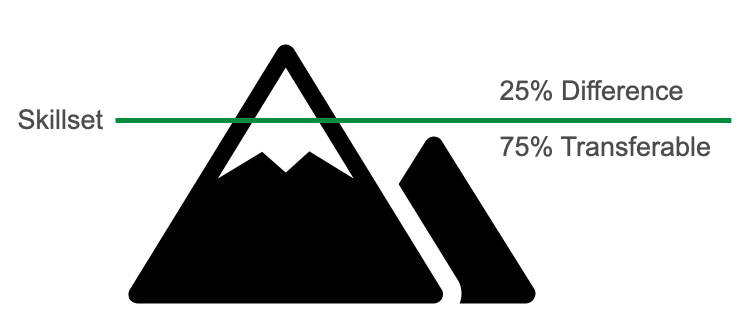
I would say for the most part, the things that are different are new features that are not in QlikView, the UI/UX, and the analytical shift. With that said, there is also now a skillset gap that wasn’t there before: software development.
Going Past the Box
Whether it’s grandiose ideas or a feature that isn’t in Qlik Sense yet, you can get there by utilizing Qlik APIs. This will require building a new skillset or utilizing a resource that has experience in software development, something that wasn’t necessary in QlikView. While it isn’t necessary to extend the Qlik Sense platform, you definitely can do it yourself or look to others that have.
There is a thriving community on Qlik Branch who have uploaded open source extensions and have built many of the extensions you can think of. If you require support, there are 3rd party extension companies like VizLib and trueChart that have a wide offering of extensions. If that doesn’t fulfill your needs, you can build your own. Qlik has made this easier by creating JavaScript libraries to assist with interacting the APIs. Also, if you’ve ever experienced the Qlik Community, then you already know how helpful other people can be in assisting you on your endeavor.
Data Governance
There is a big responsibility as developers to empower the users, which makes data governance that much more crucial. Self-service won’t mean much if every business user is coming back with a different result. To facilitate this, you will want to make sure to leverage Master Items. To make sure people have access to data they should or are editing/creating things they should, you will want to investigate Data Connections and Security Rules.
Things to Keep in Mind
Single Layer
In QlikView, you can layer objects over one another. There are layers -128 to 127, giving you a total of 256 layers. I would leverage this to create different UI/UX mechanics or custom KPI layouts, among many other things. In Qlik Sense, you have one layer. One.
While migrating apps you will need to keep this in mind and start to think of it as a single pane of glass. However, some of the things you needed multiple layers for are no longer necessary. A great example is a hide/show additional filter pane. This is built into the core product and you no longer need to stack multiple objects onto one another with hide/show conditions to give the user the ability to filter through additional fields without cluttering the screen.
Folder Structures
My folder structure was very dear to me. I used it for every app that I built and leveraged including scripts to make the folder paths simple and intuitive. Qlik Sense, however, is a bit different. First major difference is that all apps in an environment are in a single folder, created during the installation. This also means that relative paths from the binary aren’t used, unless you use Legacy Mode. What you will need to do is create a folder connection and then have your folder connection be relative from there. Keep in mind you can only go deeper; you cannot go up a folder connection due to security reasons. Aside from that, it is the same and you can have your QVD folders, script folders, and whatever else you need and group them logically.
Responsive
Qlik Sense is fully responsive. You no longer need to create separate apps to be accessed on mobile or determine the most common screen resolution in an organization. It’s one of those things that just works. One thing to note is how extensions respond. Some work as expected, while others may need extra space because they don’t scale as smoothly as native objects.
Release Cycle
Qlik Sense releases a new version five times a year, in February, April, June, September and November. These upgrades are also feature packed, unlike QlikView upgrades which have been more about security and performance improvements. With that said, staying up to date on the newest release is a big task. I would suggest coming up with an upgrade process, whether that is every other year, every 6 months, waiting until there is a feature you want, or there is a crucial bug fix. It is worth noting that every Qlik Sense release is supported for 2 years, so you should stay within that window. I believe you should upgrade every 6-12 months to the second newest release unless there is a patch out for the latest release.
To reiterate, there are still some features missing from QlikView. However, they have been knocking them out left and right: always one selected, hide/show columns, alternate states, containers, etc. This will continue to happen and is worth keeping an eye on to see what features are included on each release.
Dev Hub: QlikView Converter
There is a QlikView converter. This tool will migrate QlikView binaries (.qvw) to Qlik Sense (.qvf). This will bring over the load script, available charts, and expressions, among a few other things. I’m not going to go in depth on how to use it, however I will say this. Don’t blindly convert your QlikView apps. Take some time to plan the migration and think about how to leverage this analytical shift between products. There will be some that may be pretty much identical, however I believe there will be many that you can truly evolve when migrating to Qlik Sense.
Closing Thoughts
At the end of the day, moving from QlikView to Qlik Sense is a big step. Though it is a step I strongly believe is in the right direction. Given what I have covered above, I would suggest preparing a plan on migrating. Take some time and figure out what you want to achieve with this migration and what you need to do to accomplish it. Qlik has made it even easier to do with announcing their unified license, meaning a single license can be used for both QlikView and Qlik Sense. I would suggest leveraging this to kickstart your Qlik revolution. It is an exciting journey and I hope this post has help prepare you for it. If there are any additional questions or help you need, please don’t hesitate to reach out.
Trey is a Lead Consultant – Data Visualization at Bardess Group. You can find Trey on Twitter and LinkedIn.


