You know that feeling you get picking up on a BI project that has been worked on by other people for months? All that data pouring in from different databases, spreadsheets and in-line loads, the practically untestable reloads of tables to get ten-line IF statements to rough-house-massage data into intelligible form, the thousand lines of sparsely documented (politely speaking) code with mangled spider webs of function and dysfunction, suddenly plopping into your lap like spaghetti and meatballs sans plate?
Suddenly it’s yours! All yours.
If you are consulting, you know this feeling. No avoiding it. The trick is to get over it fast by figuring out what the heck is going on. During this process you are likely to discover errors, and the faster you can move through your personal discovery phase and squash a couple of bugs the better.
I find visualizing clients’ BI processes promotes rapid understanding and enhances communications phenomenally. I use the app iThoughts HD, a mind-mapping program that alone is worth the price of an iPad.
In the example below square-cornered rectangles represent QlikView ETL tabs, rounded rectangles are tables (green=persistent, gray=temporary) and underlined objects are data sources. The arrow-ended connecting lines show data movement.
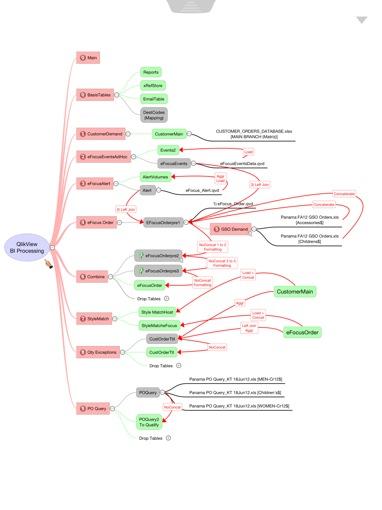
It took a couple of hours to build, and gave me an understanding of my client’s data flow that would have taken quite a bit longer via the muddling-through-figuring-it-out-as-we-go approach. I encourage you to give it a try, and would love to hear how it works out for you.