Unless you’re one of our customers, chances are low you’ve opened up an analytics dashboard and thought to yourself, “Wow, this looks amazing” or better yet, “The user experience of this dashboard is brilliant!” And that’s for a very simple and fundamental reason: for years, the aesthetics and overall user experience of business intelligence dashboards have taken a back seat to the function and accuracy of the data they represent. Well, that’s changing. The democratization and ultimate institutionalization of design-centric thinking is ushering in new approaches across organizations, including how data and internal tools are not only presented, but also in ways that take into account the fundamental needs of those using them.
That’s where User Experience and Design comes into play.
By introducing a wide range of discovery methods and visualization strategies, businesses across the world and across all industries are providing innovative solutions to problems that many didn’t realize they suffered from; it’s the process of discovery and investigation into the workflows and behavioral patterns of your users that yield the most promising outcomes.
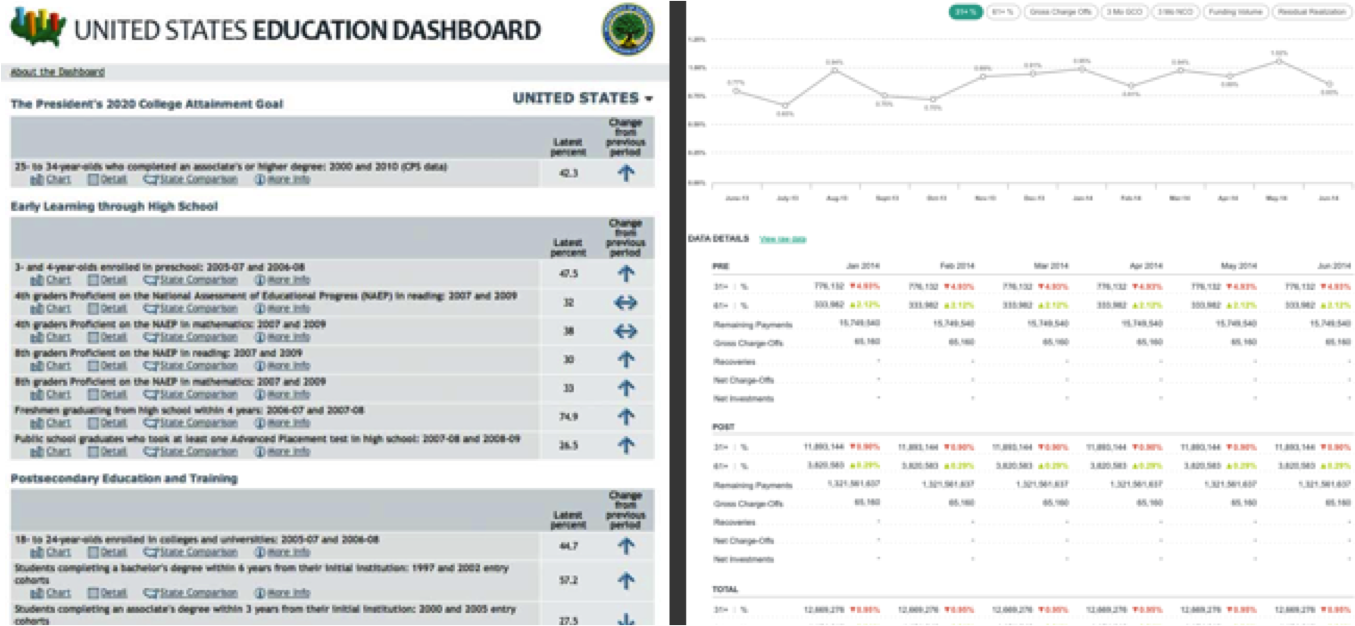
When you consider a simple side-by-side of a classic data table vs. a properly designed dashboard version, the difference is quite stark.
Imagine for a moment that your data, the residue of business, has the same voice and importance as say, your web site or other marketing materials. What would that voice tell you? How unhappy would it be? And how would you prioritize design process into your intelligence toolsets after hearing it?
There are some quick and basic product strategies I’d like to share here. These are certainly not geared specifically to data or business intelligence, but more so the understanding of the user and their intentions. Maybe they can help you in the interim until a larger effort can be coordinated.
- Who is using it and what they need out of it.
- Are there diametrically-opposed use-cases?
- What is the technical proficiency and experience of the users?
- What are they doing?
- How are they currently interacting with it?
- Is it easy?
- Are there problems?
- Declutter
- Emphasize the important parts
- De-emphasize the secondary information
- Remove the irrelevant
- Guide the user
- Your users are hoping and expecting you to help them accomplish their work, present the application in a way that not only facilitates their goals, but makes it as quick and painless to accomplish as possible.
- Rinse & repeat
- This is an ongoing process, don’t just throw something over the wall and call it a day. If you provided a successful solution then chances are there will be MANY new ideas and discussions that result from your work. This is the invitation to loop back to the beginning.
It can take some time and may not be spot-on the first go round, and that’s ok. There are plenty of experienced User Experience professionals around the world that are capable of helping you identify the needs of your internal and external users.
But what about the impact of a well-designed dashboard application? Well, let’s think about it. Providing quicker, more efficient, easier to use applications will save time and reduce the cognitive friction of your team. However the larger impact is the clarity and insight that new experience may offer. By presenting data-related information in a new and interesting way, the 360-view unfolds and your team will uncover opportunities, risks and approaches that may have stayed hidden.
Wouldn’t that be nice?