There will always be situations where the data you get isn’t at the same granularity as the other. The benefit of Qlik is you can leverage the associative model to account for these scenarios. Some instances will call for a link table, others a concatenated fact, but in the end you will be able to associate the data so you can visualize and compare them effectively.
Here is a super simple example of sales data that is at the Product level, while the budget is at the Product Category level. There are many ways to handle this scenario given the limited amount of fields, however I think it is worth showing in this way so you can directly see how associate across a field.
Data
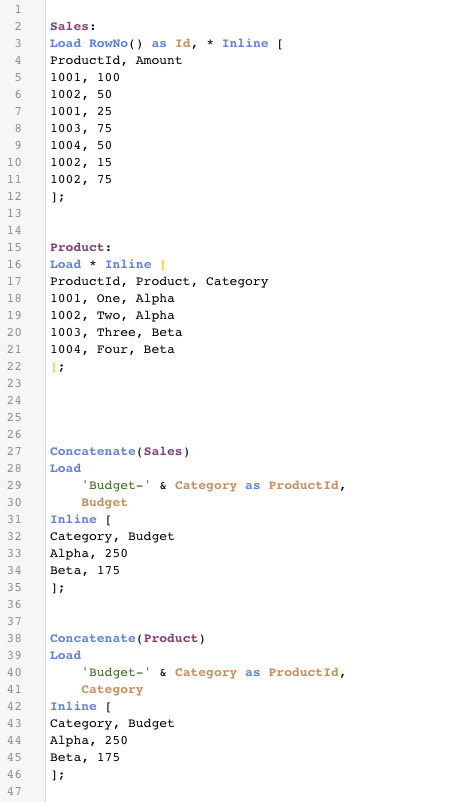
If you look closely, I am leveraging the ProductId field to tie the Budget in the Sales table to the Category field in Product table.
This will let us do the following:
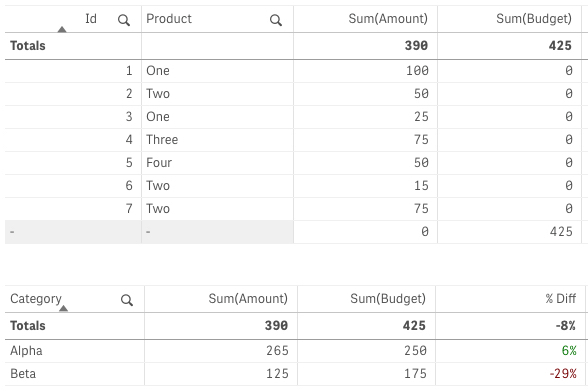
I included to Budget column in the top chart to show you that you won’t be able to correctly visualize at the granularity beneath it.